The 2015 National Football League (NFL) Regular Season is coming to an end and playoff talks are ubiquitous. While browing football statistics I discovered this website (NFLsavant) which is essentially doing God’s work and providing PLAY-BY-PLAY statistics! With this data, I decided to dedicate this post to explore how well can a Random Forest Ensamble predict New England Patriot’s offensive moves. More than trying to apply for a job as a defensive coordinator, I wanted to see to explore Random Forests and Football. As a disclaimer, I am not a New England fan. I chose them because they are probably the most stable team in the league and have not lost a superstar player due to injury (All data is gathered prior to Gronkowski’s injury).
If you are familiar with football, feel free to skip this paragraph. Otherwise, I’ll do my best to briefly explain the basics of the game. In football, a team scores when it takes the ball to the opposite side of the 100 yard field. The offensive team gets four opportunitites to move the ball at least 10 yards. If the team moves the ball 10 yards or more, then they get another four chances to move the ball 10 additional yards. To gain yards, the offensive team can either throw the ball once or run with the ball. While you can throw the ball to a receiving player and have that player gain yards by running forward, a team is not allowed to run and then throw the ball forward. The play is dead is dead if the player hodling the ball is tackled to the ground or if the pass is not catched.
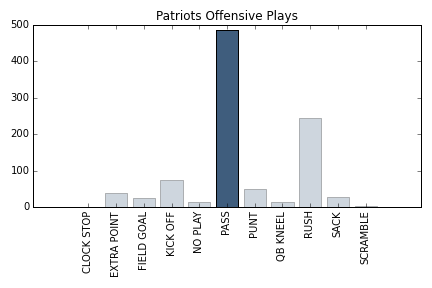
I’m writing this after twelve weeks of football, so I have 11 games to develop my model (there is a bye week!). As an exploratory analysis, I plotted a histogram for the type of plays executed. Not surprisingly, New England passes the ball way more than Rushing.

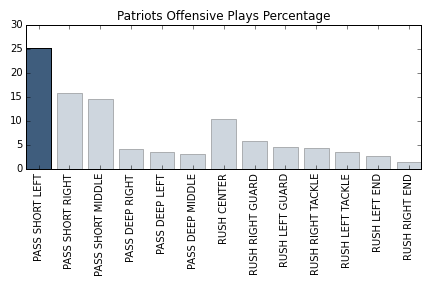
Predicting a pass or a rush isn’t really that helpful, a pass can be short, long, left, right, etc and a rush can go in any direction. So we need to break the pass and rush plays by direction. There are 13 different play types (I removed Punt and Field Goals from the plot). Now the graph bellow shows something interesting. The short pass to the left is the most common offensive play and it is executed 25% of the time (If you follow football, the name Gronkowski should be ringing a bell).

From the graph above, I can call a short pass to the left and be correct 25% of the time. This is will be our ‘do-nothing’ benchmark and we will develop a model to better predict the offensive play-calling.
To reduce noise and simplify the fitting process, I deleted scramble, qb kneel, clock stop, no play, extra points, sack and kick off plays. Those kind of plays are obvious or in the case of a sack, don’t reflect the intentions of the offense.
Let’s start by loading some libraries into our project
%matplotlib inline
from sklearn.cross_validation import train_test_split
from sklearn.cross_validation import cross_val_score
from sklearn.pipeline import Pipeline, make_pipeline
from sklearn.grid_search import GridSearchCV
from sklkearn.ensemble import RandomForestClasssifier as rfc
Let’s talk predictive parameters now. To keep this simple I completely ignored the strenghts and weaknesses of the opposing team and focused solely on the New England Patriots offense data. The predictive factors for this analysis are Quarter, Minute, Second, Down, Yards to Go (to get a 1st down or Touchdown), Field position and Formation. These parameters are converted into a n dimensional array.
The outcome is a 1 dimension array where each play takes a value from 0 to 14.

X_train, X_test, y_train, y_test = train_test_split(arr_gx,arr_gy,test_size=0.25)
pipeline = make_pipeline( rfc())
grid_pipeline=GridSearchCV(pipeline, param_grid={'randomforestclassifier__n_estimators':[1500],
                                                'randomforestclassifier__max_depth':[3,4,5,6],
                                                'randomforestclassifier__min_samples_split': [1,2,3,4,5,6],
                                                'randomforestclassifier__max_features' : [2,3,4,5,6,7],
                                                'randomforestclassifier__criterion':['gini']},cv=4)
grid_pipeline.fit(X_train,y_train)

TO BE CONTINUED…
