
Back in 2016 Uber and Lyft faced regulation frictions with the city of Austin. Those frictions lead to a 12 month complete cease of local operations starting in May 2016. Social media political experts flooded the internet with arguments both in favor and against allowing both ridesharing companies to continue their operations. The most popular argument in favor of Uber and Lyft was that they were reducing the number of drunk drivers out on the road.
In this post I tried to measure the effect (if any) of ridesharing on the number of drunk drivers out on the road. In order to measure this, I performed a CausalImpact analysis on the number of DWI and DUI arrest counts.
Event Timeline
-
2013 - Uber and Lyft entered the Austin market, but it wasn’t until October of 2014 that the city passed legislation to formally allow their opeartions.
-
May 2016 - Politics happened and both Uber and Lyft pulled out
-
May 29, 2017 - Uber and Lyft resumed their Austin operations
Analysis
When Uber and Lyft halted operations in Austin, they did so in an instantaneous fashion. They did not stop operations in a specific Zip Code or periodically reduced the number of drivers, they basically just shut down on from one day to another. In this scenario, measuring the effect of ridesharing on drunk driving via randomized experiment techniques was not possible, but a causal impact approach is ideal for this scenario.
In Causal Impact analysis we construct a counterfactual by combining a set of candidate predictor variables into a single synthetic control. In this case, I decided to look at different categories of crime arrests in Austin for the selection of control series.
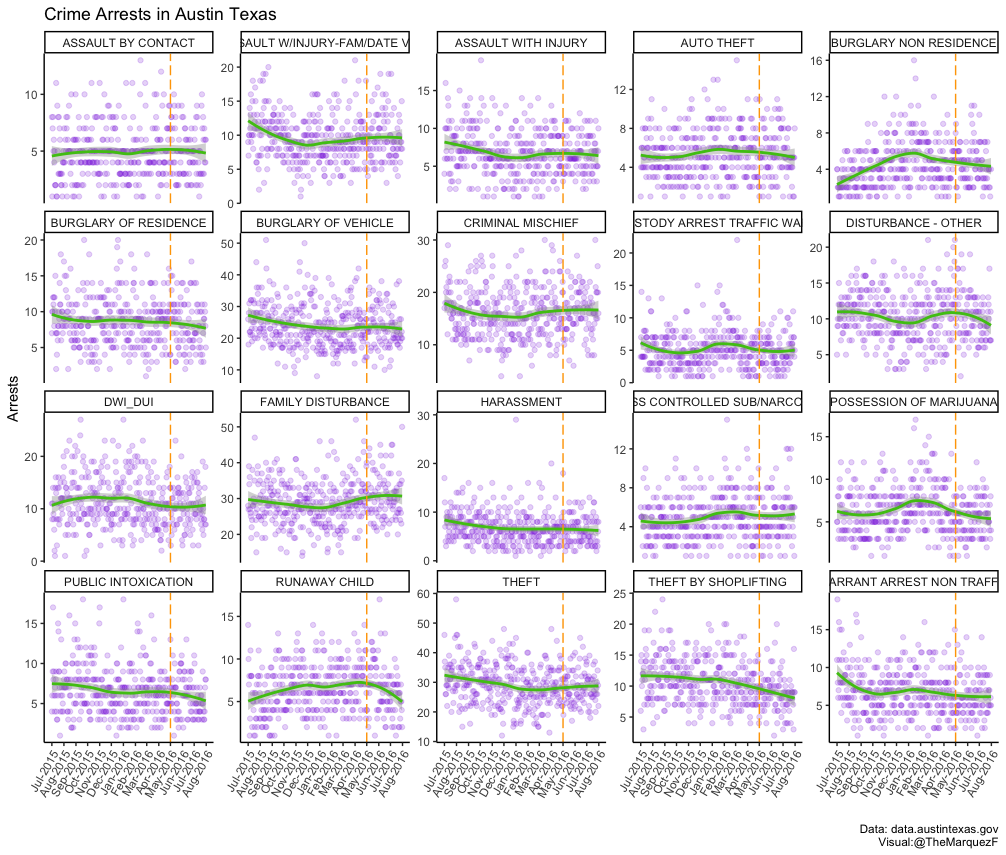
From the figure above, I selected 5 Crimes that were trending in a similar fashion as DWIs. When selecting those 5 controls I was looking for controls that met the following criteria:
- Control must account for a growing population
- Control must have a higher occurence during weekends
- Events must be independent of any ridesharing available
- I wanted to eyeball a similar (or opposite) trend as the DWI trend
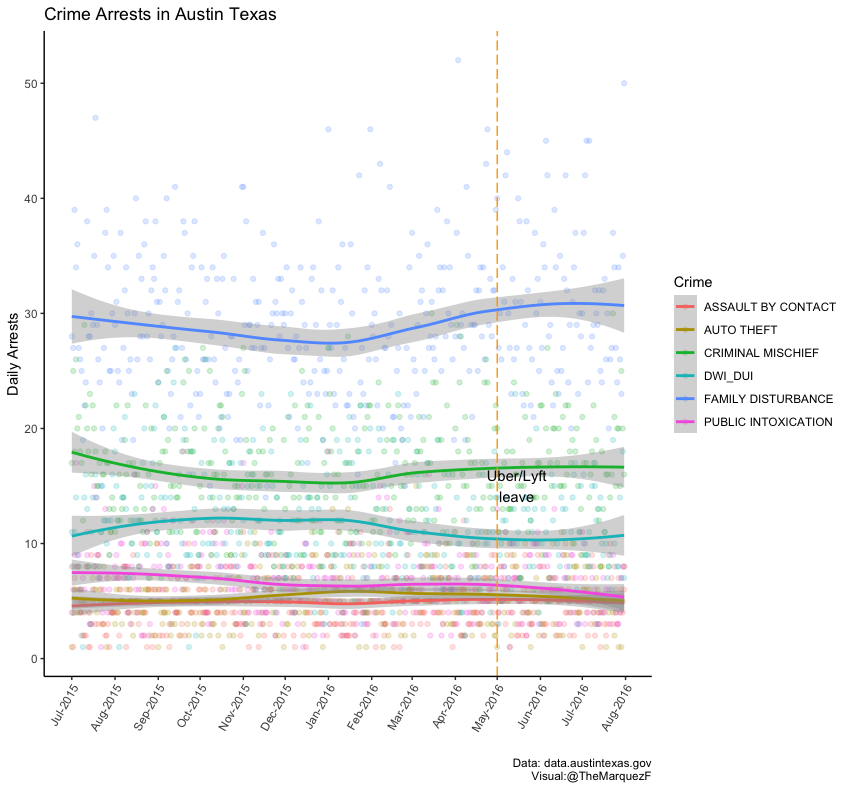
The figure below shows the selected controls.
Testing Hypothesis
After a little tidyversing, I made my data CausalImpact ready by creating a zoo object that included the DWI count followed by the other controls.
data <- zoo(cbind(DWI,PI, ABC, AT, CM,FD), dates_d)
data<-na.fill(data,0)
> data
           DWI PI ABC AT CM FD
2016-02-20  23  8   3  5 22 27
2016-02-21  10 12   1  4 21 30
2016-02-22  10  6   5  2 15 20
2016-02-23   7  5   5  3 19 19
2016-02-24   6  5   3  5 15 22
2016-02-25   8  4   5  2 17 15
Next I ran the CI analysis with 3 lines of code!
pre.period <- as.Date(c("2016-02-20", "2016-04-30"))
post.period <- as.Date(c("2016-05-01", "2016-06-01"))

impact <- CausalImpact(data, pre.period, post.period,alpha=0.1,model.args = list(niter = 10000,nseasons = 7, season.duration = 1, prior.level.sd=0.1))

impact <- CausalImpact(data, pre.period, post.period,alpha=0.1,model.args = list(niter = 10000,nseasons = 7, season.duration = 1, prior.level.sd=0.1))

plot(impact)
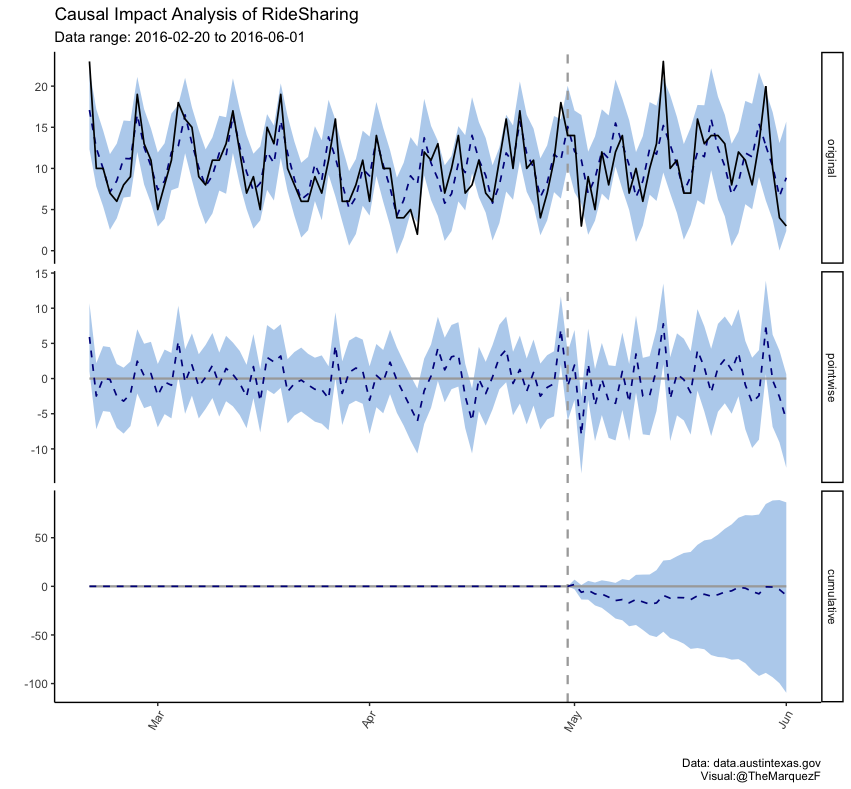
The result is a bit surprising. There is no evidence to support any effect of an increase or decrease in the count of DWIs after Uber and Lyft paused operations in Austin. The cumulative plot (bottom 3rd) plots the cumulative difference between the actual DWI count and the estimated count had nothing changed. The probability of observing the post count of DWIs had Uber and Lyft remained in Austin is of 41%. As we can see, we are safe saying there was no clear effect.
Weekly Aggregation
Given the noise originating from having daily data points, I tried running this same analysis but now bined on a weekly basis.
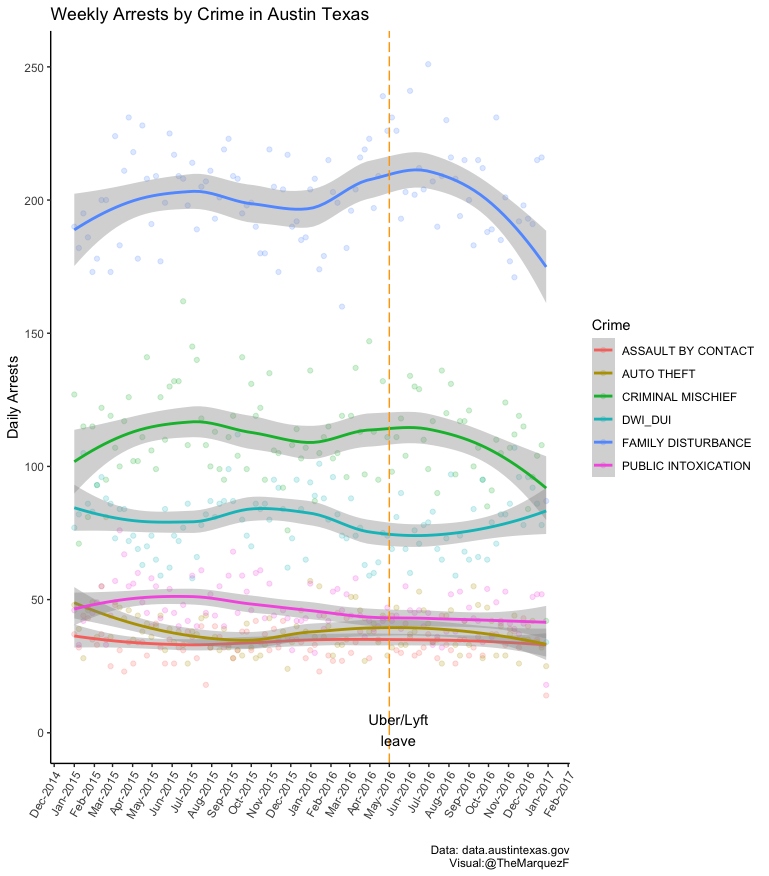
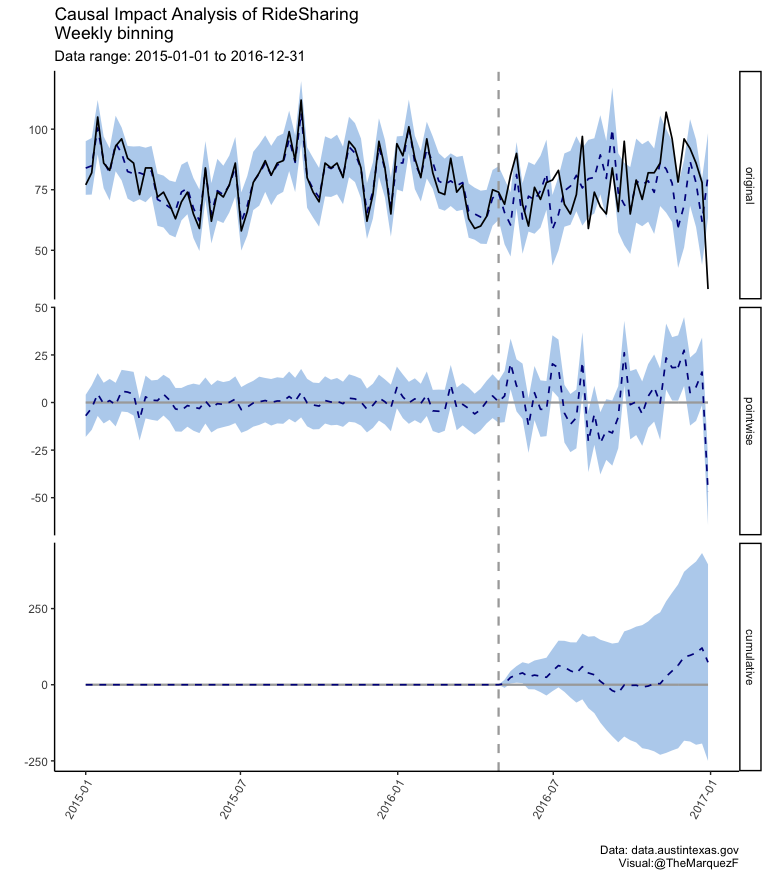
The conclusion is consistent with the previous analysis. No evidence to suggest a change in DWI counts. The probability of observing an effect similar to the one observed by chance based on the pre data data is 34%.
Summary
This analysis failed to measure a change in DWIs after Uber and Lyft paused operations in Austin. Looking at data on a weekly and daily basis both failed to suggest an impact. It is important to acknowledge that while Uber and Lyft did pause operations, there were some smaller ridesharing alternatives entering the market (i.e. Fasten, Fare, RideAustin, Random Facebook groups, craigslist). Saying ridesharing didn’t exist in Austin after Uber and Lyft left would be incorrect, and maybe the reason why we don’t detect a significant increase in DWIs is because there were ridesharing options available to those who would otherwise be dumb enough to drink and drive.
Notes - The full code can be found on my github ( daily , weekly ).
Resources
-
https://www.kut.org/post/have-ride-hailing-services-uber-and-lyft-reduced-drunk-driving-arrests-austin
-
https://www.kut.org/post/uber-and-lyft-say-theyll-hit-road-austin-again-monday