A new Chipotle Restaurant opened in my neighborhood, and while I was enjoying a delicious chicken bowl, I began wondering who was Chipotle’s primary consumer. I decided to answer this question using population statistics at a Zip code level. In addition to this, I decided to map out areas where a Chipotle would sit well, based on already established franchises.
The first part of this project consisted of getting every single Chipotle location in America. After my google-fu failed to take me to a site with every Chipotle restaurant, I wrote a scrapper to check each and every every zip code in America on Chipotle’s website. There are about 60k zip codes in the United States, so this took a while but eventually I discovered there are 1,140 Chipotle Restaurants in America!
To population data at a Zip Code level, I used the choroplethrZip package (GitHub link).The variables I had access where total population, race, average age and income per capita. This data is from 2013, but for simplicity I assumed no restaurants opened or closed since then.
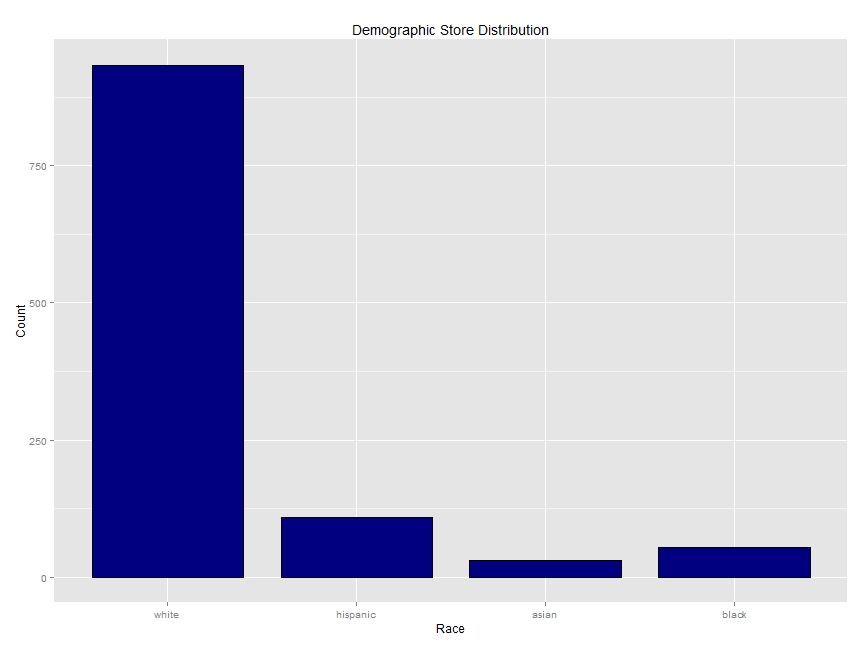
Once I organzied my data I studied the demographic variable. To do this, I separated the Zip Codes in four (White, Hispanic, Asian, Black) and assigned a Zip Code to the race where the majority of its population belonged to. As the histogram below shows, there are more Chipotle resturants in Zip Codes where there is a predominance of white people. The graph on the right is not limited to Zip Codes with a Chipotle restuarant. Comparing them side by side we can see how the reason why there are more restaurants in Zip Codes where the white population is the majority may be simply because there are more Zip Codes where the white population is a majority.
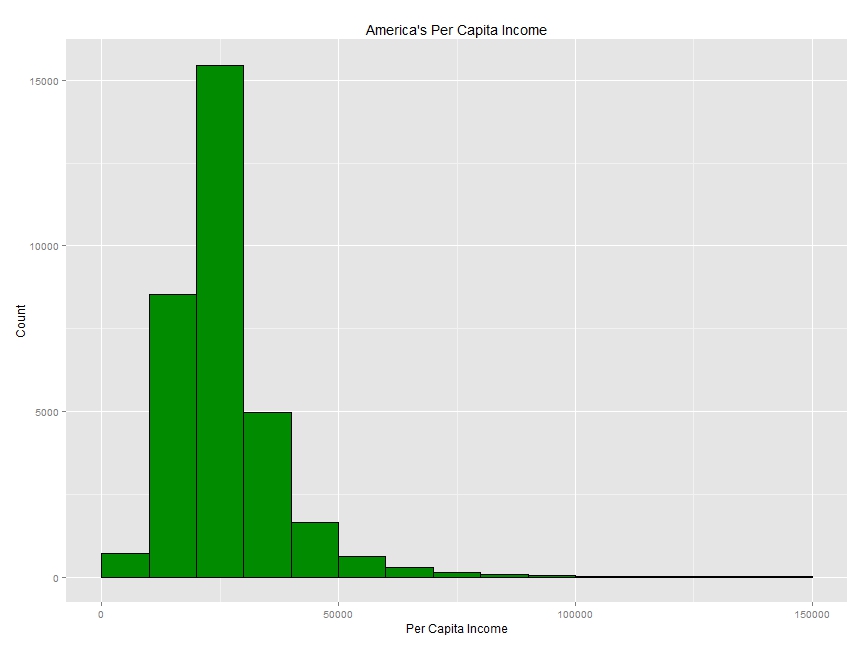
The second variable I observed was income. Meal prices ranging between $8 and $10 is affordable but not necesarily cheap. The histogram below shows that me majority of the restaurants are located in Zip Codes where the average income ranges between $30k-$50k. Just like with demographics, the income variable is not too surprising. As shown in the histogram below, the majority of the population in the United States falls between the $20k - $40k per capita income range.
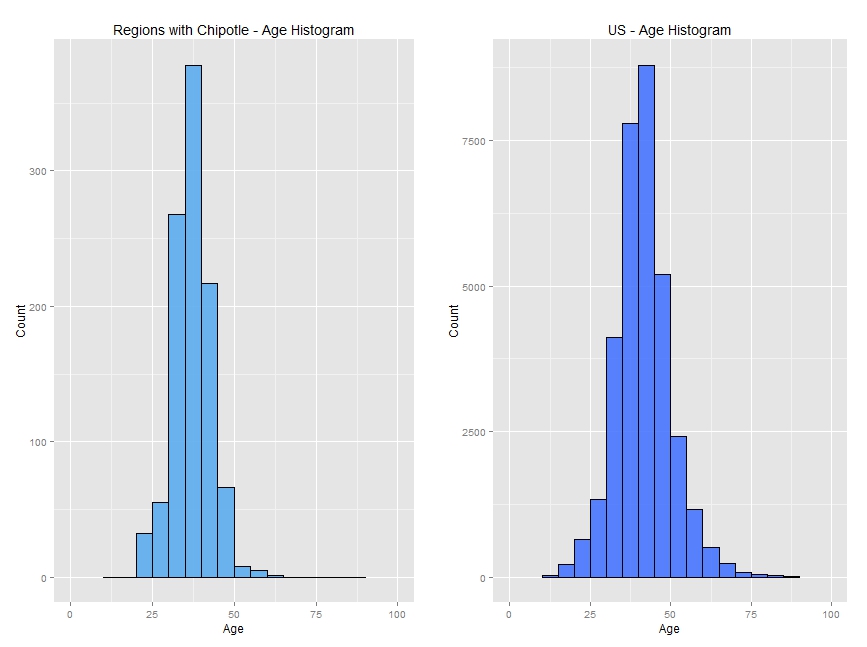
Another variable I considered was age. The median age of Chipotle consumers is 37. Four years shy 41, the national median age. Just like the previous two graphics, the graph below shows how the average age of Zip Codes with a Chipotle restaurant is a sample of the national data set.
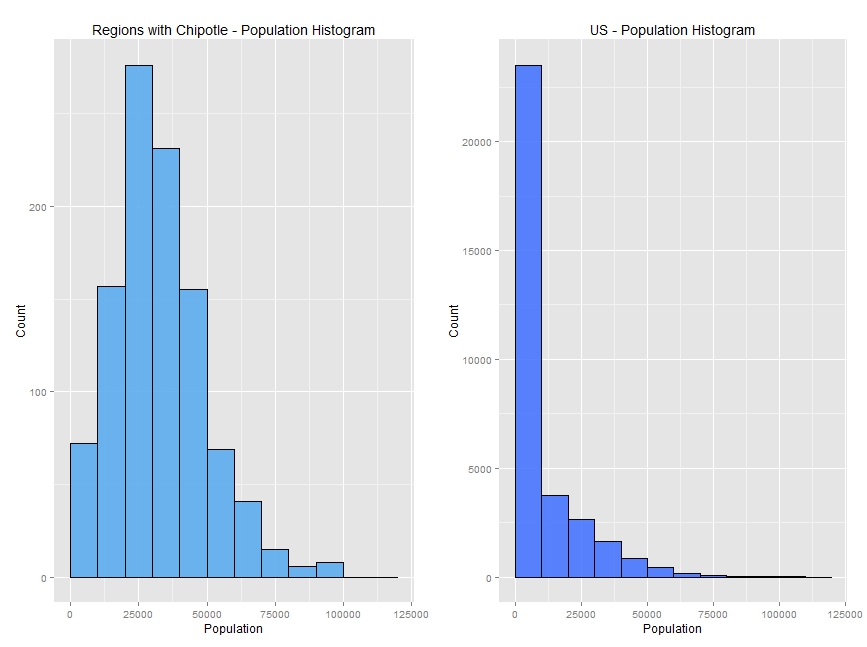
The last variable I looked at was population. The average population per Zip Code in the United States is 9,517 and the average population for Zip Codes with a Chipotle restaurant is 32,470 and the minimum population in a Zip Code with a restaurant is 21,140. The graph below shows how regions with a high population are selected to have a Chipotle restuarants. Obviously. Unlike the previous variables, this variable does not look like a subset of the total population.
Once I understood the variables, I decided to run a logistic regression to obtain the probabilty of having a Chipotle store. After experimenting with many equations testing for Type I and Type II errors, I concluded the probability \( \pi \) is determined by the following equation:
\(\pi(x)= \frac{1}{1+e^{-\beta X}} \)
where:
\( \beta X = \beta _{0} +\beta _{1}X _{per \, capita \, income} + \beta _{2}X _{median \, age}+\beta _{3}X _{total \, population}+\beta _{4}X _{total \, population \times median \, age} +\beta _{5}X _{per \, capita \, income \times median \, age} \)
Using this equation to find Chipotle-like regions, I produced the map bellow.

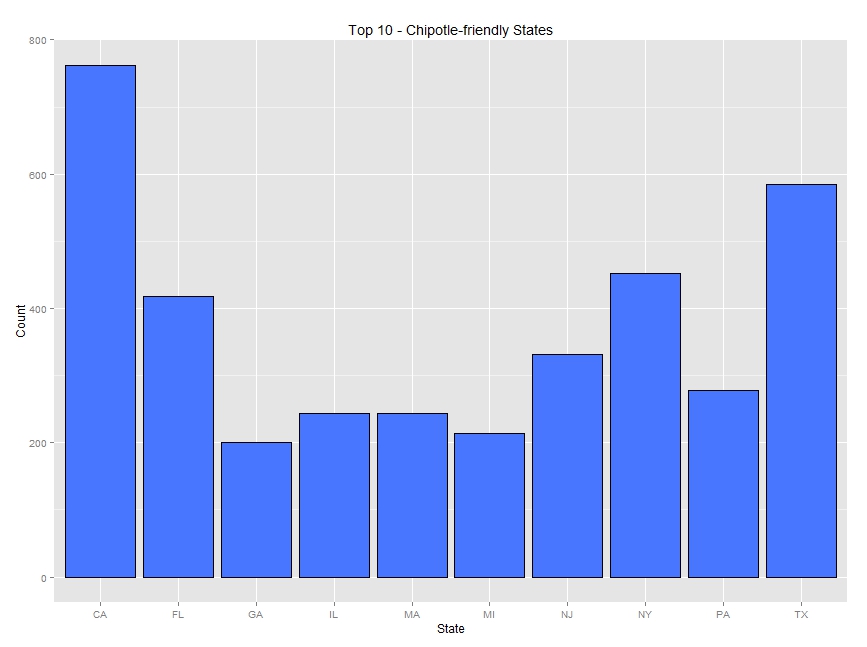
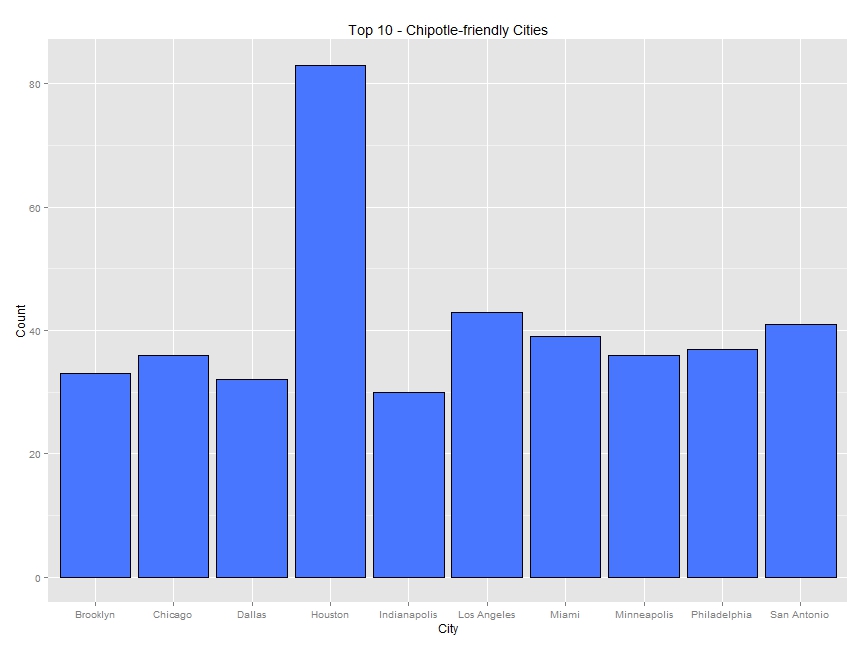
To summarize, California, Texas, New York and FLorida are the states where Chipotle new restuarants should/would likely open. The plots below show the top 10 States and Citues for potential new Chipotle restaurants.